9:57 AM - Interest rates continue to fall on the rally in the 10-year; dollar still weak against Euro. Russell has moved back into the Tuesday range; other averages hovering closer to their highs. Semiconductors have also backed off. I'd expect a test of the large cap highs as long as the dips in the TICK stay modest. With that, I'm off to work--my other work. Have a great rest of your day; update tonite on the Weblog.
9:50 AM - We're knocking on the door of Tuesday highs in the major indices; failure to sustain buying above those highs would normally target the day's average price as a downside target. Still no substantive selling in the TICK, but Russells looking tired here.
9:45 AM - Dollar continuing to fall vs. Euro.
9:43 AM - Persistent buying has taken ES above the Tuesday highs, but has also lifted ER2 significantly. The bias is to the upside with the shift mentioned below, but I'm also watching for evidence of a pullback to the Tuesday range to return us to the range bound mode. One of the things I researched some years back was breakout in the TICK from a previous TICK range. That's what we had this AM. My research back then, which needs to be updated, suggested near-term intraday price strength following such breakouts. Note how we never had extreme negative TICK readings in the AM and then broke to new TICK highs. The Russell often benefits from such moves.
9:30 AM - An interesting idea would be to buy the Russells on a TICK pullback as long as the TICK doesn't break down to new lows for the day and the Russells stay above their recent lows. The TICK distribution has shown an upward shift reflecting buying in the wake of those intermarket dynamics mentioned just below.
9:25 AM - Don't know if you caught that. Bonds rallied, dollar fell hard against Euro, and the NASDAQs caught a bid and rallied. Some very interesting intermarket cross currents going on, and it's not coming from locals. The dollar drop is pretty significant.
9:19 AM - You can see how ES is continuing to trade within its overnight range, even as we continue to see relative weakness in ER2, semis, and emerging markets (EEM). I wouldn't be a buyer until I saw buying interest come into the small caps and semis, with more robust TICK levels. Nor am I inclined to sell ES, which, like the DAX, has held up quite well given the weakness in Asia. Longer term, I have trouble finding reasons to be a buyer if interest rates are going to stay firm and if those emerging markets continue to lag.
9:09 AM - Interest rates have fallen back a bit here. Volume continues moderate. As long as we can trade 15,000 contracts or so every five min in ES, there should be some movement for the short-term trader. It's when we get below 10K per five min period that things get deadly slow and I stop trading. I've found keeping those volume levels by my side to be helpful. Let's me know when it's worth playing, when it's not. The main thing is whether or not volume is above avg or not for that particular time of day. When well below avg, not worth trading.
9:00 AM - OK, what happened is that I saw that the market wasn't moving meaningfully higher on the TICK bounce and that two of the three averages (NQ and ER2) had already broken below their overnight lows and the semis were still not catching a bid. So I shorted ES for a very short trade back to the overnight lows, but took a while to get filled at my level. I don't want to hold positions for long if we get a slowing trade ahead of the Fed. So, if I can get five ticks, that's fine. Targets have to be based on opportunity and volume equals opportunity. I may well not trade again this AM.
8:56 AM - Back flat for now. I'll explain in a moment.
8:47 AM - I'm a little short on that TICK bounce, but more to feel out the mkt than anything else.
8:39 AM - There's no way I'm a buyer in the face of weakness in the semis and small caps; the Russell is well back into yesterday's range, even as DAX and ES hold up better. I may be on the sidelines for a while. No real buying interest in the TICK thus far. We're back at the VWAP in ES. Selling picking up.
8:34 AM - Early impression is of relative weakness in semiconductors and small caps; large caps holding up better, with declines leading advances by almost 600 issues. Volume quite moderate ahead of all the news.
8:21 AM CT - Good morning. GDP came in a bit stronger than expected and we're seeing a bump up in interest rates, with the 10 year coming in at close to 4.9% as I write. Stocks are selling a bit lower in the futures markets, although the report caused no important selling. The dollar's a bit stronger vs. the Euro on the news. At 8:45 AM CT, we have Chicago PMI; at 9 AM, we get a report on construction spending; and at 1:15 PM CT, we get the Fed announcement. Bottom line is that I expect traders to be reining themselves in prior to these reports, so I don't expect a busy or particularly directional trade in the AM unless a number is well out of line. Pivots for today are on the Weblog; my recent post examines what happens after flat weeks such as we've just had. My main reaction to this AM is surprise that the weakness in Asia--particularly China, which plunged over 6%--has not filtered down more to the U.S. futures. This leads me to believe there's a bid beneath this market and, if early selling holds above the Tuesday pivot, we should be testing the Tuesday highs and R1 level. I'd be more cautious about buying if selling pushes us below overnight support at 1429.25.
Wednesday, January 31, 2007
Market Context: What Happens After a Flat Week of Trading?
The past five trading sessions have been almost perfectly flat in the S&P 500 Index (SPY) on a close to close basis. My previous post examined how we can handicap the odds of moves out of a flat period by observing what other, correlated markets have done during the flat period. In this post, we'll look at how the flat period is situated within the movement of the longer time frame--the context of the flat period--as a tool for determining the odds of upward or downward directional movement. Specifically, we'll look at how the S&P 500 Index moves in the five days following a five-day flat period (i.e., a five-day period in which the index does not rise more than .20% and does not fall more than -.20%).
Going back to 2004 (N = 769 trading days), we have 93 periods of flat performance. Five days after the five-day flat period, SPY averages a gain of .27% (58 up, 35 down). That is modestly stronger than the average five-day change for SPY for the entire sample of .16% (439 up, 330 down).
When both the five and the twenty day periods prior to the flat period were up in price (N = 49), the next five days in SPY have averaged a gain of only .09% (31 up, 18 down). When both the five and twenty day periods prior to the flat period were down in price (N = 16), the next five days in SPY averaged a substantial gain of .80% (12 up, 4 down). We thus see better performance following flatness in a down market than flatness in an up market.
Overall, when the 20 days prior to the flat period were up (N = 67), the five days following the flat period were up by an average of .15% (42 up, 25 down). When the 20 days prior to the flat period were down (N = 26), the next five days in SPY averaged a healthy gain of .59% (16 up, 10 down).
In short, we see during the bull period of 2004-present that flat periods have tended to be followed by strength. The context of the flat period does matter, however, as we've tended to see larger short-term gains following flat periods in down markets than flat periods in up markets. Interestingly, my data suggests that the flat periods in an up market tend to rise in the short run before falling back; the flat periods in a down market tend to fall before rallying. Thus, for instance, 16 of the 26 occasions in which the flat period occurs in a down market take out the prior week's low price. It's thus the trajectory of change--and not just absolute change itself--that is important to the short-term trader. I will have more to say about trajectories in future posts.
Tuesday, January 30, 2007
Tuesday January 30th Morning Comments
9:58 AM - OK, you can see how the rally stalled once the buying activity could no longer push prices higher. In general, once you identify a candidate morning low, it makes sense to put in an initial position and use pullbacks in the TICK as opportunities to add to the position, as long as the TICK bursts take you to successive price highs. If you can't hit your price target and the buying sentiment (TICK, volume at offer) isn't moving you higher, then you have to entertain the hypothesis that you're in a trading range environment and take what you can from the market. In general, I've been front-running the market with my initial positions and need to work on that initial entry timing. The smart strategy is to wait for the selling to hold above a prior price low and then begin the buying. I'll be reviewing the last few days to sharpen that strategy. Volume is tailing off here, suggesting continued range bound action. I'll update tonite on the Weblog; have a great remainder of your day!
9:43 AM - My apologies; I've been fielding phone calls all AM from trading firms, trying to trade, and trying to update the blog. I can't recommend that as a way to trade! Anyhow, I had modest profits in the position and was noticing that, despite the good action in DAX, the bounces in the TICK were not moving my market higher. That turned out to be a good short-term decision. As long as the TICK declines were at higher price levels and the bounces were at higher levels, it made sense to hang in there for my price target. But when we got the TICK bounces at 9:35 and 9:40 and couldn't make new highs, I decided to take what the market was giving me. Admittedly some of the decision was that, right now, I'm completely distracted and not in a good mind set to be holding any position of size.
9:41 AM - Took my money and ran.
9:19 AM - Note the nice breakout to the upside in DAX. Semis lagging.
9:17 AM - The TICK pullback, holding above the AM lows, gave a nice entry; now we have to stay above that level in any selling. My target is the preopening high in ES, then S1, then Monday's high.
9:07 AM - If we can hold above the AM lows in ER2 on selling bouts in TICK, I'd add to my long. With a small position, as long as we hold above the previous day's low on selling, I'm willing to hold. But I'm not going to put on size until the buying is clearly manifest and selling dries up above the AM lows.
8:56 AM - Just got off phone with DJ News. Clearly it's premature to be long, given ER2 selling. Prices moved right back into value area and below in ER2.
8:45 AM - ER2 showing relative weakness; need to see some buying interest there; DAX holding up; volume moderate, with usual local-driven crosscurrents, but no distinct buying or selling.
8:35 AM - Long a bit ES here.
8:32 AM - Watching NQ and ER2 closely. If they take out their preopening lows, I'm much less likely to be aggressive with any longs in ES.
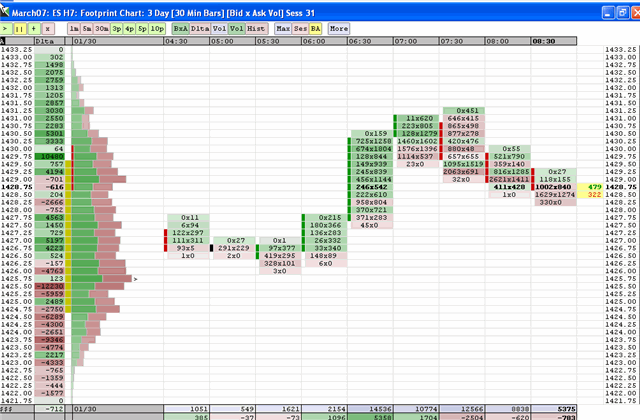
8:19 AM - Here's what my Market Delta screen looks like this AM. Note how we couldn't sustain volume to the upside and pulled back into the region where most of trading was recently transacted (left Y axis). That chunky volume region will act as a magnet for prices that try to break out; we'll need good volume and participation to sustain such a break.
8:06 AM CT - Good morning! I don't expect a lot of fireworks today, as we await the Fed announcement tomorrow. Jason Goepfert, who does excellent work with his SentimenTrader service, notes that we tend to have narrow range days prior to such Fed announcements. We have consumer confidence numbers coming out at 9:00 AM CT, and that's pretty much it for economic releases on the day. I have a mild bullish leaning for the day; check out my most recent post. It's a nice illustration of the kind of research I do each evening and AM prior to the open to try to identify the odds of a rise or decline during the day's trade. As always, pivot levels for the day are listed on the Weblog. As I write, we're trading slightly above the Monday VWAP, reflecting a boost in the DAX (and Euro) prior to the open. We've since come off the pre-open high of 1431.25, so that will be a natural level to keep an eye on. If we get buying that peters out before taking out that pre-opening high, I'd look to sell for a move back to the Monday pivot/VWAP. If we get selling that holds above the Monday low--and especially above the pivot/VWAP--I'd be looking to take out that preopening high. At this juncture, I look for us to test the highs from the previous two trading sessions, but will need to see the usual evidence of buying interest in the TICK and volume at bid vs. offer to take that trade. Back after the open!
When Markets Are Flat, Look At What's Moving
Yesterday, the S&P 500 Index (SPY) closed very near where it opened the day's session. Such flat days represent a kind of short-term trading range. During the day's activity, we moved both above and below the open, but could not sustain either extreme. The question for the short-term trader thus becomes: What are the odds of breaking out of this short-term range with an upside vs. downside directional move? In the case of a day such as today, when we're beginning a Fed meeting and investors will be waiting for the Wednesday announcement, such a test of either the previous day's high or low may be all the directional activity we'll get.
There are two principles I follow when analyzing flat market periods: 1) Identify which sectors of the market *are* moving during the flat performance and then break down the sample of historical flat periods by this sector performance to see if there is a next-day directional edge; and 2) Identify the longer time-frame context in which the flat period is occurring and see if flat periods with a similar context (i.e., whether the flat period is occurring in a rising or falling market on a longer-term basis) display a directional edge. In this post, let's look at analyzing flat periods on the basis of what's moving among sectors. In my next blog entry, we'll examine the role of context.
Monday's action was noteworthy because we had a solid gain in the Russell 2000 Index (IWM) during the flat day's performance in SPY. So let's go back to 2004, identify all flat days in SPY, and then see if the relative performance of IWM makes a difference for next day performance.
What we find is that, since 2004 (N = 772 trading days), we've had 112 daily trading sessions in which, open to close, SPY has been up by less than .20% but not down by more than -.20%. Interestingly, the overall correlation between SPY and IWM daily price change in percentage terms from open to close, is a very high .87. But when we look at the 112 flat days in SPY, the correlation with IWM is only .11. This relative absence of correlation enables us to meaningfully break down the flat days based on IWM performance.
Overall, when SPY has been flat (N = 112), the next day in SPY has averaged a gain of .05% (58 up, 54 down). No real directional edge there. Now, however, let's break down the sample based on the action in IWM.
When SPY has been flat on the day and IWM has been strong (i.e., rising more than .40%, as we had on Monday; N = 17), the next day in SPY averages a gain of .27% (13 up, 4 down). Fully 14 of the 17 days trade above the highs from the flat day; only 7 of the 17 days break the prior day's low. When SPY has been flat on the day and IWM has been weak (i.e., falling more than -.40%; N = 30), the next day in SPY has averaged a gain of only .03% (15 up, 14 down, 1 unchanged). Only 19 of those 30 occasions have ended up trading above the high from the flat day; 13 of the 30 have broken the flat day's low price.
What this suggests is that when small cap stocks have been strong during a flat market day, there is underlying strength in the market. This buying interest tends to carry forward the next day, making it reasonable to look toward the prior day's high as a potential price target for intraday trading. Note that this hypothesis can be tested out by looking at other measures of market strength during flat periods, such as performance from other sectors (e.g., QQQQ) and indicator levels (e.g., advancing vs. declining stocks). Such validation is important when sample sizes are small.
As always, I don't take these as mechanical trading signals. Rather they are sources of directional hypotheses regarding near-term market action. If I see early selling drying up in ES when price is holding above the low from the flat day, I'm likely to be a buyer in ES. Conversely, if I see large traders hitting bids in ES on the heels of a spike in oil prices or interest rates, I will not blindly follow the hypothesis. Indeed, I might conclude that the market is not living up to historical norms and factor *that* into my decision making.
The beauty of this kind of historical market research is that it supplements just about any trading style. You may, for example, utilize CCI patterns (like Woodie's traders) or chart formations (such as gaps) for your market setups. Because most stocks are highly correlated with the movement of the S&P 500 Index, knowing the odds of a rising or falling market can help you decide whether or not to take a particular setup, and it can help you decide how much size you want to devote to that setup. My personal experience is that, when several different historical patterns are pointing in the same direction *and* I see market sentiment (NYSE TICK, volume at bid vs offer) pointing in that same direction, that is a very high probability trade and I want to use my maximum size to take advantage of that. Such trades--even just once a week--can account for a large portion of your overall profitability.
Monday, January 29, 2007
Monday January 29th Morning Comments
9:51 AM - There's no way I'm shorting this market again with TICK readings staying positive and ER2 continuing to show relative strength. If anything, I'd be looking for TICK pullbacks as places to by ES for a move back toward Friday highs. I'll post again if I see anything major; otherwise have a great rest of your day. Market wrap up tonite on the Weblog.
9:45 AM - OK, let's wrap up for this AM. I started the day with an eye toward the Friday average price, skeptical of any moves away from that level. We got early buying in ER2 and DAX, but underperformance in semiconductors and NQ. That was my first clue that the buying would not be sustained. I took an initial small short position, because TICK was still positive and ER2 was still making new highs. In retrospect, I probably jumped the gun and should have waited for ER2 to stop making new highs on TICK bursts. Anyway, I kept the loss small on that trade--under a point--on the small position. Keeping losses small gives you a chance to be green on the day. Then we got some selling across the board, though not dramatic, so I waited for the next TICK burst that couldn't push ER2 and DAX to a new high. That had me going short with greater size to take advantage of a move back toward the Friday pivot. We hit that level, I waited to see if we'd get follow-through selling, we didn't, and that was my trade and, quite possibly, that will be my morning. Notice how important position sizing, risk management, and clear profit targets are to short-term trading. This is a pretty typical day for me. Not at all exciting. I have one decent idea and execute it decently. My only questionable move was getting short with the small position as early as I did. Not a good idea to try to call highs; wait for the selling to show you that a high has been made. Even on profitable days, there are always lessons to be learned and drilled into the (thick) skull! I'll post once more this AM.
9:35 AM - We hit my first target, the pivot, so I took some profit off the table, esp. in light of ER2 holding up relatively well despite the obvious downward shift in the TICK distribution. Note we've yet to see any solid selling sentiment in TICK and volume at bid in ES has been moderate.
9:27 AM - Adding to short positions on TICK surges that can't produce new highs.
9:17 AM - I continue to be unimpressed with the price follow through in ES and NQ, though small caps have been strong and there's been net buying sentiment. I'm basically waiting for weakness in ER2 and TICK to go short again in ES for a move back down to that avg price from Friday.
9:08 AM - Buying in the TICK has been persistently high, meaning that a short trade even if well timed is good only for a scalp. Took small loss on my short. Nice pop in the DAX. We'll need to see evidence of sellers coming in before jumping to the short side for more than that scalp.
8:56 AM - I have a small short on ES on that last TICK move up. Let's see if we break out or move back toward the average price.
8:51 AM - Volume is definitely coming in on the buying and you can see the moves start first in ER2. TICK hit quite an extreme, as we work off the excess negative values from Thursday. Note relative weakness in semiconductors so far. Also NQ did not make new AM highs on the recent thrust; worth watching.
8:46 AM CT - Note we've taken out Friday highs in ER2. I'll be watching to see how prices hold up on pullbacks in the TICK. If we hold above the Friday pivot, it makes sense to buy ES for a test of Friday highs. If selling comes in with some size before we can break Friday highs in ES, I'd be looking for a move back toward that average price. So far, we've seen no selling of consequence in TICK and we're seeing more volume at offer than bid in ES, with a nice volume pop on the upmove.
8:42 AM CT - As long as DAX and ER2 show new AM highs, I'm not going to short the large caps; notice how the pop in ES was preceded by the DAX and ER2 strength, taking us toward a test of the resistance.
8:36 AM - Got some initial buying in ER2 and follow through buying in DAX, but sellers were waiting for the pop. So far no distinct buying or selling sentiment, with declines leading advances by about 50 issues, volume moderate in ES, and pretty even volume at bid vs. offer early on. Watching carefully to see if bulls can succeed in getting us past the earlier mentioned resistance.
8:24AM - No major economic reports today, as we gear up for the Tuesday/Wednesday FOMC meeting and Friday's unemployment report. We're seeing some resistance around 6715-6717 in the DAX (cash) in pre-opening trade, and the 1430 area represents afternoon resistance in ES from Friday's trade. I will be watching carefully to see if morning buying can break those levels. If not, I expect moves through the Friday Pivot/VWAP and the Friday lows. Pivot levels for the day are in the most recent Weblog entry; also check out the summary of how I trade intraday in my latest Trader Performance entry. Basically, I'm going to view with skepticism moves away from the Friday average price, making the market prove to me that it can sustain buying above 1430 or selling below 1422. Otherwise my leaning will be to fade moves that cannot generate an increase of stocks making new highs/new lows. Let's see how early volume looks; as I mentioned recently, that helps me figure out the odds of a range bound market.
Wealth and Aspirations for Wealth: What Makes Us Happy?
 A number of studies of subjective well-being and economic status have been conducted, attempting to answer the question of whether economic prosperity also brings emotional fulfillment. Three interesting conclusions follow from this research:
1) Worldwide and within countries, well-being correlates positively with income - The map above is the first integration of research across countries that links subjective well-being (happiness, satisfaction with life) with income levels. As you can see, well-being is highest in the most economically developed nations and, as a whole, lowest in underdeveloped, third-world nations. This meshes with longitudinal research within nations that shows that well-being is lowest among individuals who are unemployed and who live at poverty income levels. People who can meet their basic needs for food, shelter, and children are understandably more happy and fulfilled than people who cannot. People also appear to experience more well-being when they are engaged in productive work.
2) Beyond a threshold level of income, increased wealth does not contribute to additional well-being - Per capita income in Germany, for instance, nearly doubled since 1970, but reported levels of well-being remained constant. Indeed, within Germany, income correlates only .11 with subjective well-being. Similar low correlations are found elsewhere in Europe and the U.S. In other words, once people can meet their basic life needs, wealth only modestly contributes to *additional* happiness. And this appears to be a function of factors such as health, quality of social relations, and the quality of government in the country. It's not that wealth doesn't matter; it's that, beyond a certain level, other variables contribute more to well-being.
3) Aspirations for wealth correlate negatively with subjective well-being - This is a very interesting finding. People tend to adapt to the income level they attain and, very often, aspire to even further wealth. The research finds that well-being is a function, not just of one's absolute income level, but also the gap between one's current level of wealth and one's desired level. When people perceive a large gap between the wealth they have and the wealth they want, their well-being is significantly diminished. In fact, the negative emotional impact of high wealth aspirations for a well-off person is every bit as large as the positive impact of economic gains for a poorer person.
One way to frame this relative to the above map is that setting wealth aspirations well above one's current level of income and savings is equivalent to taking a psychological vacation to a third-world country--particularly if the aspirer doubts his or her ability to reach those income goals. Making money is a natural goal for financial traders, but the quest for ever more lavish lifestyles is not necessarily a formula for life fulfillment and, indeed, can place us in the psychological poorhouse.
Sunday, January 28, 2007
The One Thing That Transforms Stress Into Well-Being
Cognitive psychology teaches us that it's not events in themselves, but how we process those events, that determines our emotional reactions. The most powerful tool for transforming stress into well-being is the ability to embrace failure. The stressed individual equates failing with being a failure, as something to be avoided at all costs. The individual with well-being may well fail just as often--indeed, Dean Keith Simonton's research suggests that greatness is accompanied by a high failure rate, but an even higher rate of productivity--but views those failures as learning opportunities and worthy challenges.
I can't tell you how often this has occurred in my experience with traders: Trader A loses money on his or her first two trades, loses confidence, and stops trading, only to miss out on subsequent opportunity. Trader B loses money on his or her first two trades, becomes angry and frustrated, and leaps into a third--and even more disastrous trade. Trader C figures out what the two losing trades are revealing about the market and uses the information to profit from that third trade. The difference is not in trading methods or P/L after the initial two trades. The difference is that Traders A and B are threatened by failure, and Trader C embraces it. Failure is an opportunity to learn. Failure is there to teach us. Failure pushes us to become more than we are at present.
I found a website with a few fine quotations that make the point more eloquently than I ever could:
Experience is the hardest kind of teacher. It gives you the test first, and the lesson afterward - Anonymous
I haven't failed; I've found 10,000 ways that don't work - Ben Franklin
If you want to increase your success rate, double your failure rate - Thomas Watson, Sr.
The only difference between a diamond and a lump of coal is that the diamond had a little more pressure put on it - Anonymous
Life is not a matter of having good cards, but of playing a poor hand well - Robert Louis Stevenson.
Finally, a personal story. When I wrote my first article for an academic journal, the editor returned the manuscript full of red and blue pencil marks. Just about every sentence was torn apart. The editor explained that they could not commit to printing my article, but would look at a revised version based on the comments on the manuscript. I was crushed. I called the editor and asked why he didn't like my article. He was stunned. He said, "I loved your article. Do you think I'd take the time of suggesting so many revisions if I didn't like it? If we don't like an article, we don't waste our time on it. We send it back with a few comments and a thank you." Heartened, I made the changes, learned a ton about what editors look for, and got the article printed. That led to several more articles for the same journal, which led to articles for other journals, which led to the first of my four book contracts.
Had I taken the initial feedback as failure, I would be unpublished to this day. By embracing my "failure", I learned, and I succeeded.
Now go forth and identify your greatest failure of the past week and figure out what you'll learn from it that will help this week's trading. For you, as for me, failure may just end up becoming your greatest teacher.
Three Steps Toward Improving Your Well-Being
The first posts in this series introduced a questionnaire for traders and explained how the items tapped into subjective well-being: the balance of positive vs. negative emotional experience. My most recent post explained how to interpret the questionnaire results and why it is important to sustain a favorable emotional balance for optimal performance. In this final entry, I will outline a few basic ideas for generating and sustaining a high level of well-being.
1) If you're out of balance, figure out if the problem is specific to trading - The question to ask is whether you feel out of balance in general, or whether those feelings are mostly limited to your trading experience. If the problem is trading-specific, you'll want to identify causes of your frustration and stress. Among the common culprits are: a) trading size that is too large for your account, creating losses and gains that are outsized relative to your total capital; b) normal slumps that occur when markets change and we get strings of losing trades; c) trading patterns that don't truly provide you with a directional edge in the market; and d) trading a time frame, market, and/or style that is not well-suited to your personality and personal needs. Teasing apart the common causes of performance problems will help immensely in exploring possible solutions.
2) If you're out of balance in general, figure out other aspects of life that might be contributing to distress and a relative lack of well-being - We know from research that the quality of interpersonal relations--the depth, not just frequency of contacts--and the experience of mental and physical vitality are crucial to well-being. Many traders so emphasize their work that they neglect these other areas of well-being. Then they wonder why they're not feeling more fulfilled even though they're making money. We also know from research that a sense of autonomy and competence are critical ingredients for well-being. Do the various activities of your life enable you to employ your skills productively, toward goals that are meaningful to you? Many times we become so caught up in low-yield activities and chores that we fail to put time into the priorities that could bring fulfillment. A nice measure is calculating the proportion of each day that you spend doing the things that make you happiest and most satisfied--and then actively structuring your days to maximize that proportion.
3) Consider keeping a diary of your emotional experience, inside and outside of trading - Researchers call it "experience sampling", and it's an excellent way to track the ebb and flow of positive and negative emotions. You want to jot down what you've been doing at the time and how you are feeling, with several readings per day. Examine what specifically you are doing in your trading when you're feeling good about it, and what you're doing when you have a more negative emotional balance. Similarly, keep tabs on good days and not-so-good days: are you doing something different on those good days with respect to work, relationships, exercise, eating? Finally, if your diary shows no relationship between your activites and your mood--and especially if you find yourself chronically out of balance emotionally--consider a medical evaluation. There are many physical problems that can contribute to an absence of well-being, including hormonal imbalances, seasonally-related affective problems, and sleep disorders. Similarly, such factors as anxiety disorders, depression, and drug/alcohol abuse can contribute to a lack of well-being. Your diary can be very helpful in distinguishing when problems are situational vs. chronic.
Perhaps the most important strategy of all is to have activities and interests in your life that sustain you during the inevitable lean times of trading. As I mentioned in my previous post, markets change and those shifts take a toll on our trading performance. Slumps are every bit as real for traders as for athletes. If all your emotional eggs are in the trading basket, you'll be vulnerable--and it will become impossible for you to do the new learning needed to internalize the new market patterns. If, however, you have many facets of life contributing to well-being, problems in trading need not become personal threats and jeopardize your overall sense of happiness and satisfaction. Diversification is a strategy that works both in monetary and personal investments.
Saturday, January 27, 2007
Will The Market Trend And How Far Might It Go?
 In recent posts, I have described how I handicap the odds of directional moves in the equity indices. By defining pivot levels of support and resistance, we can then calculate the odds of hitting those levels based upon the unfolding real-time sentiment of large traders, as reflected in the number of stocks trading at bid vs. offer compared to a lookback average (Adjusted NYSE TICK) and the proportion of the day's volume trading at bid vs. offer.
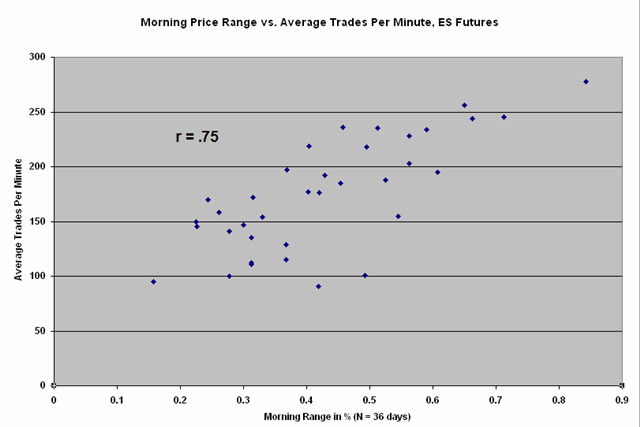
While these measures tell us a good deal about the directionality of moves, they are not the best predictors of the *extent* of market movement. In my research, the standard deviation of morning NYSE TICK values correlates .48 with the size of the morning's trading range. That's a meaningful correlation, but we can do better.
Above, we see a scatterplot of the ES market from December 1st to the present (N = 36 trading days). Specifically, we're looking at the average number of trades placed in ES per minute during the morning and the average size of the morning's trading range as a percentage of the opening price. The upward slope of the chart is apparent: when we have more activity in the market (more trades being placed), we get a wider trading range. The correlation is .75.
Of course, most traders don't track, minute by minute, how many trades are being placed in their instruments. More often, they track total contract or share volume. As it turns out, the number of trades and the number of contracts traded in ES are very highly correlated: about .92. As a result, tracking real-time volume in the morning ES provides us with a .68 correlation with the morning's trading range, going back to the beginning of December. Indeed, if we look over the past 200 trading days in SPY, daily volume correlates with daily trading range by the same .75 level. In short, volume reveals volatility.
By updating volume every five minutes and comparing it to average volume as of that time of day, we can estimate the amount of movement that the market is likely to give us. Many times, if we get a breakout from a trading range during the morning, volume will expand, as trend followers jump on board the move and traders leaning the wrong way have to exit their positions. As volume picks up, we also can raise our estimates of likely movement for the day.
The two questions to be asking throughout the trading day are:
1) How directionally biased is the market compared with normal?
2) How active is the market compared with normal?
The first we gauge by comparing the current day's NYSE TICK readings with average readings over the past 20 trading sessions. The second we assess by comparing the current day's volume with average volume for that time of day over the past 20 trading sessions. What we're really asking is: Will this market be likely to trend, and how far is it likely to go? Question One helps us address whether a market will be range bound or trending; Question Two helps us establish price targets and trade exits. Much of the skill of trading consists of remaining flexible enough to update the relevant market data through the day and revise one's expectations.
Interpreting the Personality Questionnaire for Traders
I recently posted a personality questionnaire for traders and explained related research into subjective well-being. In this post, we will take a more detailed look at the questionnaire results and what they might mean for your trading. If you haven't yet completed the questionnaire, you might want to fill in the ten items before continuing.
Before launching into the interpretation, let me emphasize the limitations of the questionnaire. First off, we're looking at the relative frequency of positive and negative emotional experience specifically as it pertains to trading. The questionnaire asks to rate these emotions over the past two week period. As a result, what we have is a snapshot of your trading experience. This is not a mental health questionnaire, and it is not intended to diagnose psychological disorders. Nor is it necessarily a picture of your trading experience as a whole. The past two weeks could be greatly influenced by situational factors, such as difficult trading markets, poor physical health, or stresses from your personal life impacting your trading. To obtain a broader picture of your trading experience, you'd need to take the questionnaire at different points in the year and look for common threads.
Notice, following the research of Ed Diener and colleagues, the emphasis is upon the frequency--and not the intensity--of emotional experience. Having very high highs in emotion tends also to be associated with very low lows; it does not guarantee an overall sense of well-being. Rather, it is the frequency with which we experience positive vs. negative emotions that contributes to our physical health and general sense of emotional wellness.
So when you look at your questionnaire results, you want to first focus on the summed scores for the odd items (subjective well-being, or SWB) vs. the even items (distress). Because there are five items for positive emotional experience and five for negative emotional experience, the minimum SWB and distress scores would be 5 and the maximum would be 25. In general, we can look at anything above 15 as indication of relatively frequent experience and anything below 15 as an indication of relatively infrequent experience. In general, it's ideal to see the positive item score meaningfully higher than the negative item score--a 2:1 ratio is quite favorable. If the negative item score equals or exceeds the score for the positive items, it suggests a relative imbalance in emotional experience.
Now let's think about what that means. What we're really looking at is the quality of your experience when you're trading. Do you have fun when you're trading, or is it stressful? Are you satisfied with your results, or are you discouraged? Do you find trading energizing or exhausting? Do you feel in control of how you perform, or do you feel that markets end up controlling you? Do you feel competent to succeed, or do you feel that your goals are beyond your reach? Each of these is a facet of positive and negative emotional experience. The questions don't tell us why you might be feeling positively or negatively; they merely take your emotional temperature. If your positive experience nicely exceeds your negative experience, you have a normal, healthy emotional temperature. If the reverse, you have a kind of emotional fever; trading, in such cases, is not contributing to your well-being as a person.
Why is this important? When we are operating at a feverish emotional pitch, with more frequent negative than positive experience, our state interferes with concentration, and it interferes with learning. Like the student experiencing test anxiety, we lose the ability to access the knowledge and skills that we possess. As I stress in my books, this is because, under conditions of negative emotional arousal, we are no longer activating the brain's executive center: the frontal cortex. If we are corporations, our brain's cortex is our CEO. When we are out of balance, we are operating without a CEO. Our ability to accurately perceive, judge, plan, and act becomes impaired. This burdens our trading performance.
Conversely, as Csikszentmihalyi's research suggests, we are most likely to perform optimally when we are in a state in which our skills are well-matched with the challenges we face, enabling us to become fully immersed in our activities. It is possible to sustain this sense of flow only when we are performing in a niche that enables us to experience ourselves positively. In a very important sense, psychological distress is anti-flow. It represents the inability to immerse ourselves positively and meaningfully in what we're doing. Such immersion typifies elite performers across fields as diverse as athletics, art, and chess because it represents an enhanced state of learning. Think about reading a book that bores you vs. reading a book that absorbs your interest. When you lose yourself in a book, you'll remember the details of the plot and characters. When the book is uninteresting to you, you'll skim over the contents rather than internalize them. So it is with markets and the learning of ever-changing market patterns.
Notice how I sneaked that last part in there. Markets are continuously changing. Their trends change, as do their patterns of volatility. Even the best-researched mechanical trading systems degrade over time. For this reason, traders are continuously learning, unlearning, and relearning market patterns. Their survival crucially depends upon their ability to sustain states of enhanced learning. Surely this is the great emotional challenge for traders: to sustain well-being even during those trading slumps when markets are shifting and playing havoc with our pattern recognition. How can we do this? That will be the topic of my final post in this series.
Friday, January 26, 2007
Friday, January 26th Morning Comments
9:38 AM - If we're putting in a bottom here, we should start seeing TICK lows (pullbacks to negative TICK) at higher price lows. Ideally, we should also see TICK lows at successively less negative levels. Similarly, we should get higher prices on rallies in TICK. The lesson I want to stress for today's session is position sizing. We had huge odds of taking out yesterday's lows, creating a very favorable edge. Once selling started appearing in the market, you have to participate with all the size you can muster. You can lose money on 2 or 3 small trades, make money on one high odds trade with size, and wind up the day/week a solid winner. Your position size should reflect your confidence in the trade. Yesterday I mentioned putting small size on when you're feeling out a market. Today it was time to press the advantage. Those odds don't come along every day. Have a great weekend; update on the Weblog tonite.
9:30 AM - Notice how, on the downside breakout, we had over 76,000 ES contracts traded in a five minute period. Such panic selling often leads to short covering, and that's why it makes sense to not chase lows after that's occurred. We're seeing some relative strength in ER2, also leading me to believe we're putting in a short term bottom. Back in a few before I sign off.
9:24 AM - Looking to see if we continue to get an upward shift in the TICK distribution, which would help us put in a short-term bottom. Again, need to sustain the buying.
9:08 AM - We broke the recent support mentioned in the Weblog and, sure enough, hit the S1 pivot level. My tendency is to take profits on big TICK moves down, simply because, with enhanced volatility, you can get some nasty short-covering bounces. As mentioned earlier, however, until we see *sustained* buying, it pays to short these bounces.
9:02 AM - Rates have jumped and stocks selling in response. Keep an eye.
8:53 AM - Note that we've still not seen the very negative TICK that we saw yesterday, but rates continue to creep up and the ER2 and NQ have already broken their recent lows. The market will have to show me sustained buying to make me a bull; otherwise, I'm leaning toward selling into rallies.
8:49 AM - Hope you were able to take some advantage of this move toward the targets of the overnight and Thursday lows. When you have odds like that, you really have to put your max size on and just hang in there to hit the targets. One trade like that can make your week.
8:38 AM - DAX coming off its highs, some selling in US indices. But advancers lead declines by over 400 issues and no substantial selling in the TICK as of yet. I was short pretty much out of the gate because of the analysis I posted and expect a test of the overnight and Thursday lows.
8:10 AM CT - Good morning! We had a continued move higher in interest rates on the Durable Goods news at 7:30 AM CT, with a spike higher in the dollar. Both of those moves have since retraced quite a bit, with the 10-year yield falling back under 4.9%. At 9:00 AM CT, we have the report on new home sales. Prices opened lower in Europe on the heels of the big decline in the U.S., but the DAX has been steadily rising since then, and that has lent support to the U.S. indices in pre-opening trade. I took a look at what we might expect following a weak day such as Thursday, and the norm was for the next day's trade to take out the lows of the weak day. So let's see how buying and selling shape up early in the AM session and see if we can profit from this idea--or from the market's inability to live up to that historical norm. Over the weekend, I'll be posting a detailed analysis of the traders' questionnaire posted a little while back, which assessed--among other things--the trader's well-being. Let's keep an eye on interest rates; I'm seeing some tendency for stocks to catch a bid when bonds also rally (lowering rates) and for stocks to sell off when bonds fall (rates rise). Back after the open.
When Markets Take a Body Slam: What Happens Next
Wrestling afficionados know that a body slam has two components: first you lift your opponent into the air, then you slam him onto the mat. On Wednesday and Thursday, we saw a body slam delivered to the equity markets, as a nice gain on Wednesday was more than reversed on Thursday. As I mentioned in my morning comments, it is unusual for a solid rise to turn around and lead to a solid decline; normally there is some rangebound, topping action in between. Thanks to weak housing numbers and rising interest rates, however, selling persisted through Thursday, creating the body slam.
I went all the way back to 1990 (N = 4298 trading days) in the S&P 500 Index (SPY) and measured the day's gains or losses as a percentage of the prior 20 days' average trading range. In all that time, I could only find 15 occasions in which a large rise (one in which the gain of the day was greater than the prior 20 days' trading range) was followed by a large decline (one in which the loss on the day was greater than the prior 20 days' trading range). Five days later, SPY was down by an average of -.43% (5 up, 10 down). That is much weaker than the average five day gain in SPY of .19% (2411 up, 1887 down). Thirteen of those fifteen occasions broke their slam day lows during the following day's trade. It appears that markets that get slammed carry some weakness forward in the near term, though caution should be taken when dealing with such small samples. It is indeed rare for large rises to be followed by large declines.
If we just look at large relative declines (drops in which the daily decline is greater than the prior 20 days' average trading range; N = 360), we can see that those by themselves do not lead to follow-up losses in the near term. Five days after a large relative decline, SPY is up by an average of .39% (211 up, 149 down). Since 2004, we have had 72 occasions of large relative declines; there is modest follow-through weakness in the following two days, with SPY averaging a gain of .02% (30 up, 42 down), but there is no bullish or bearish edge five days out. Interestingly, since 1990, 334 out of the 360 instances (and 64 out of the 72 since 2004) have traded lower than their large decline lows the following day. That suggests very near-term follow-through of weakness.
Finally, I looked at large relative declines as a function of the prior five days' worth of action in SPY. When SPY was up over the previous five days and *then* experienced the large relative decline (N = 155)--which was the case on Thursday, the next two days in SPY averaged a loss of -.16% (67 up, 88 down). When SPY was down over the prior five days and then experienced a large relative decline (N = 205), the next two days in SPY averaged a gain of .37% (124 up, 81 down). It thus appears that we're more likely to get downside follow through on a large relative decline if that decline is correcting prior strength, as is the case at present. Indeed, since 2004, when we've had a large relative decline following five days of strength (N = 42), the next two days in SPY have averaged a loss of -.14% (14 up, 28 down). That is considerably weaker than the average gain of .24% when the large decline follows five days of weakness (N = 30; 16 up, 14 down).
In sum, then, it appears that markets that get slammed tend to follow through with weakness during the following day's trade and, when following a period of strength, over the next two trading days. That will factor into my decision making for Friday's trade.
Thursday, January 25, 2007
Thursday, January 25th Morning Comments
9:54 AM - OK, time to get cracking on my work with traders. I'll post comments tomorrow AM and update the Weblog tonite. I'm continuing to anticipate a range mode for the day. Takeaway for today is this: transacting at the bid vs offer, which is what I'm tracking with the NYSE TICK, Dow TICK, Market Delta, etc, is a very short-term measure of trader sentiment. When we don't see buying sentiment following a nice up day, it makes sense to think about a transition to range bound trade and a reversion to the prior day's average prices. An absence of buyers (sellers) often precedes an influx of sellers (buyers), but it pays to wait for the latter, pick price levels, and take the high percentage trades. Have a great day!
9:48 AM - So far we're getting short covering following those surges of selling in TICK, but not sustained buying. The balance of trading has been skewed with much more volume at the bid than offer in ES, and that has been a fine guide through the day's session. Until that changes, it's premature to call a bottom and look for that trading range. It pays to let the market play its hand, find your levels, and play when the odds are in your favor.
9:44 AM - Notice the very poor follow through to the initial surge in the TICK, followed by renewed selling, esp in ES, taking us to the second VWAP level. ER2 showing a bit of relative strength here; I'm watching that closely. But as before, I need to see higher lows in the TICK to be a buyer, and I need to see lower highs in the TICK and the averages in sync to resume the short side.
9:32 AM - Financial stocks haven't done well this AM; note that we're at multi week highs in interest rates on the ten-year. Not a great environment in general for stocks. You can see, though, why I got out of my position and was anticipating a surge in the TICK; up markets usually transition to trading ranges, they don't turn into bear markets. If we start making higher lows in the TICK, I'd look to be a buyer along the way.
9:29 AM - We need to see an upward shift in the distribution of the NYSE TICK if we're going to put in a bottom and start forming a trading range. Hasn't happened yet, but I'm on the lookout.
9:22 AM - Lots of good lessons here. If a nice trade idea doesn't go your way, it's telling you something about the market. I reversed my position, was able to identify which index was the weakest, and that permitted a nice trade to our target prices. The key is keeping those losers small and then sticking with your price targets.
9:12 AM - I'm leaning to the sell side here for a test of those average price levels, simply because the market is not showing signs of buying at this juncture. I'm short a little here, but I don't see a lot of market conviction, so I play it close to the vest.
9:04 AM - Quick stop out on that trade. I'll often use early small trades to help feel out a market, and the thing we're seeing so far here is an absence of buyers. Note how we have not yet seen an elevated TICK reading, although we also haven't seen dramatic negative numbers. We continue to see more volume at bid than offer in ES and that needs to change to test the overnight and prior day's highs. Otherwise, we have that pivot level and VWAP as obvious downside targets.
9:00 AM - Bought a little ES here. Need to see ER2 hold am lows.
8:50 AM - NQ and semiconductors show relative strength; ER2 continues weaker; volume continues modest--when sectors move different ways and volume is mediocre, I look for range bound action, not big trending moves.
8:41 AM CT - Some relative weakness in ER2 possibly emerging; I'm keeping an eye on that.
8:37 AM CT - So far we're seeing some early modest consolidation of yesterday's gains with moderate volume, no sustained early selling in the TICK, but declines leading advances by about 150 issues on the NYSE. Semiconductors, which underperformed yesterday, are showing a bit of early life. No distinct trend in the indices so far; we've had more volume transacted at the bid vs. offer in ES by a decent margin, but again volume is quite moderate. No big institutional participation at this juncture.
7:57 AM CT - Good morning! I'll post a few times early this AM on the market's follow through to yesterday's solid gains. The Weblog notes pivot levels and expectations for the day. No great reaction to the 7:30 AM unemployment numbers; at 9:00 AM CT we'll get housing starts. We're seeing recent firmness in both oil prices and U.S. interest rates; that, along with the divergences noted in the Weblog, has me questioning the sustainability of this breakout. We saw 1296 stocks make new 20-day highs on Wednesday against only 413 new 20-day lows, but that is less than the new highs registered back on the 16th. We're also seeing the DAX come off its highs, and I'm noting the poor participation of the semiconductors in yesterday's rally. All in all, that has me looking to test Wednesday's highs, but it would not surprise me to see us test the Wednesday pivot level and VWAP as part of starting a trading range. Indeed, if I see early buying that can't sustain a move above Wednesday highs, my leaning will be to fade that move for a return toward that Wednesday average price. Conversely, early selling that holds above the average price would have me looking to test the Wednesday highs and R1 level. Back after the open or if some inspiration happens to strike. If you're bored before the open and want to take a personality test and read about the results, check out my most recent posts.
Subjective Well-Being: Why It's Important for Traders
Yesterday I posted a short personality questionnaire for traders; in this post, we'll look at what the results are telling us.
An important research review in the Annual Review of Psychology by psychologists Richard Ryan and Edward Deci examined what we know about positive emotional experience or what is often called subjective well-being (SWB). We often hear about how important it is to minimize stress, but an increasing body of research emphasizes that it is more critical to maximize our well-being.
One of the very interesting findings of the review is that a key component of SWB is our ability to pursue autonomous goals: goals of our own choosing. When we are free to set and pursue our own goals, we tend to be much more fulfilled than if we are pursuing goals that have been set for us. Indeed, a very recent study found that people who set and follow their own ends experience more happiness and self-fulfillment--and better physical health--than those who follow controlled goals. The key link between goal pursuit and physical health was stress and coping. High stress and the absence of autonomous goals was a recipe for lowered self-realization and increased physical symptoms. Another recent study found that it is both what you pursue--intrinsic vs. extrinsic goals--and why you pursue it--autonomously or controlled--that contributes to SWB. Being free (autonomous) to set goals that are meaningful to you (intrinsic) is associated with positive emotional experience.
These studies are but a small fraction of the large body of work linking SWB to enhanced physical health. Interestingly, such factors as salary and physical attractiveness do not predict SWB. In fact, people whose values show a preference for high income and job success over personal relationships tend to report less happiness and self-fulfillment than those who emphasize interpersonal attachments. Altogether, Ryan and Deci identify three major components of SWB: a sense of competence, autonomy, and relatedness. While happiness is an important part of SWB, there is more to positive emotional experience than just being happy. The authors stress that people with high levels of well-being also experience high levels of personal fulfillment and satisfaction with life.
The questionnaire that I posted recently does not tap into all aspects of SWB. Instead, my intent was simply to assess well-being and stress in the context of one's trading. So we can think of the questionnaire as a kind of job satisfaction measure, if we think of trading as our job/career. To provide a more well-rounded, overall assessment of well-being, we would need additional questions pertaining to the quality of one's social relationships.
The questionnaire taps several facets of well-being, including:
* Happiness
* Personal satisfaction
* A sense of energy and vitality
* Perceived competence
* Perceived autonomy
On the other side of the emotional ledger, the questionnaire assesses:
* Stressed-out, anxious feelings
* Feelings of discouragement
* Feelings of guilt or regret
* Feelings of frustration or anger
* Feelings of loss of control
Research subjects in general report higher levels of the positive emotions than the negative ones. When the even items in the questionnaire (stress) approach or exceed the odd items (well-being), we can take this as a situation that is out-of-balance. In my own research review from my recent book, I emphasized that high levels of immersion in one's trading are necessary to internalize the patterns of shift in supply and demand and make rapid and accurate decisions. It is difficult to believe that one could sustain such an immersion if trading were bringing as much negative as positive experience. Indeed, as I report in the book, the enhanced learning processes that are common among expert performers require that such immersion be a positive emotional experience.
Trading may not always be profitable, but it is important that it contribute, over time, to a sense of autonomy and competence and that it be accompanied by experiences of personal fulfillment. Without a positive balance between positive and negative emotional experience, we are unlikely to sustain the activity that will contribute to our growth and development as traders. The research also tells us that success in trading, in itself, will not necessarily bring sustained well-being. The quality--not the quantity--of our social relationships is equally important. A single-minded pursuit of trading success may undercut itself if it does not contribute to a sustained sense of self-fulfillment in life itself.
Wednesday, January 24, 2007
A Personality Questionnaire for Traders
Recent research highlights the role of our emotional experience in our health, well-being, and job performance.
The following questionnaire asks you to assess your emotional experience during your trading. Specifically, you'll be rating how often you've experienced the following feelings over the past two weeks. Below, I'll explain how to score the questionnaire; please complete the items before looking at the scoring. My next post will explain how to interpret your results.
Please use the following scale for your responses:
1 = rarely
2 = occasionally
3 = sometimes
4 = often
5 = most of the time
1) I feel happy when I'm trading _____
2) I feel stressed when I'm trading _____
3) I feel alert and energetic when I'm trading _____
4) I feel discouraged when I'm trading _____
5) I feel capable of succeeding at my trading _____
6) I blame myself when my trading doesn't work out _____
7) I feel satisfied with my trading results _____
8) I feel edgy and frustrated when I'm trading _____
9) I feel in control of what happens in my trading _____
10) I make impulsive decisions when I'm trading _____
SCORING
Add the scores for the odd items. That is your positive emotional experience score: _____
Add the scores for the even items. That is your negative emotional experience score: ____
The ratio of your positive to negative experience is one of the most important psychological contributors to your trading performance. My next posting will explain why.
Tuesday, January 23, 2007
AGG: The Aggregate Bond ETF and What It Tells Us About Stocks
With the expansion of ETFs, it is now possible for stock traders to actively participate in the fixed income markets, as well as equities, commodities, and currencies. A popular fixed-income ETF is AGG, the iShares Lehman Aggregate Fund. This ETF invests in a spectrum of U.S. debt, with about a third of the portfolio consisting of government agency debt, a quarter in U.S. treasuries, and 14% in financial institution debt. 75% of the portfolio is invested in AAA rated debt, with a little over a third of the portfolio at 0-4 years maturity and a little over 50% between 5-9 years. In short, AGG represents a relatively broad and complete spectrum of the U.S. fixed income market.
Because AGG is such a good proxy for bonds, it also provides us with an opportunity to investigate how movements in the fixed income arena are associated with subsequent movements in the equity markets. I went back to 2004 (N = 154 trading weeks) and took a look at three-week changes in AGG and what happens over the subsequent three weeks in the S&P 500 Index (SPY); the NASDAQ 100 Index (QQQQ); and the Russell 2000 Index (IWM).
When AGG has been up over a three-week time frame--meaning that interest rates are falling over that period (N = 78), the next three weeks in SPY have averaged a very healthy gain of .80% (53 up, 25 down). When AGG has been down over three weeks (N = 76), the next three weeks in SPY have averaged a gain of only .08% (38 up, 38 down). Clearly, falling interest rates (rising bond prices) have been associated with superior large cap returns since 2004 over a several week period; rising rates (falling bond prices) have yielded subnormal returns going forward.
We see identical patterns in QQQQ and IWM. When AGG has been up over a three-week time frame, the next three weeks in QQQQ (IWM) have averaged a gain of .83% (1.32%) with 41 (53) occasions up and 37 (25) down. When AGG has been down over the past three weeks, the next three weeks in QQQQ (IWM) have averaged a loss of -.22% (-.12%) with 38 (32) occasions up and 38 (44) down. Stock performance in those averages has been dramatically better during periods of rising bond prices (lower interest rates) than during periods of falling prices (rising rates).
I'm especially impressed by the magnitude of the differences in IWM performance under different bond conditions. It may well be that rising rates dampen speculative sentiment for equities, particularly affecting small caps. Conversely, an environment of falling rates might be deemed positive for growth, encouraging speculation in the small caps. With the availability of data on a variety of ETFs across asset classes, we are more able than ever to tease apart such intermarket relationships.
Monday, January 22, 2007
Monday, January 22nd Morning Comments
9:33 AM CT - OK, I'm just going to sit around and wait for another good entry point to the downside. My longer-term opinion remains to the downside given the steady decline in market momentum and participation we've seen in recent days, as outlined in the Weblog. That led me to hold a short position overnight. It went against me in preopening trade, but that didn't change the larger picture. As it became clear early in the AM that we weren't sustaining buying, it made sense to entertain the hypothesis that we weren't going to take out Friday's highs. That led to the strategy of selling bounces in the TICK with a profit target of Friday's lows. The next downside target is S2 at 1428.75; I need to see buying drying up in ER2 before pursuing that target. We're getting a few divergences here that lead me to keep my powder dry. Hope this has been helpful. Again, I'll be out Tuesday and Wednesday, but will update the Weblog tonite and will post to TraderFeed daily (but not the morning updates those two days). Have a great day!
9:26 AM CT - I'm not chasing lows here; I'm out for the time being. We're getting a little buying in the semis, NQ, and ER2. May be temporary, but it's a yellow flag.
9:20 AM CT - Just a point of clarification. When the market gives me close to 6 points in 30 minutes time, I look at the odds that we'll go straight down even further. Those odds aren't good. Hence I take what the market gives me and look to re-enter on bounces higher. That's the difference between holding a core position and sitting through those counter trend moves and trading on a short-term, intraday basis.
9:15 AM CT - OK, we hit my first profit target, so I took some off the table. Now I wait to see if buyers can come in around Friday's lows. Until we see selling dry up and some evidence of buyers coming in, I continue to lean to the sell side.
9:05 AM CT - Both volume and selling have picked up, and we've taken out Friday's lows in NQ. I continue with my initial scenario and until the market proves differently I continue to see TICK bounces as short-term selling opportunities.
8:55 AM CT - Neither the Dow TICK (TIKI) or NYSE TICK is showing particular strength, which means that we're just not getting traders stepping up to the plate and lifting offers ahead of LEI. Volume remains subdued, and we continue to see relative weakness in small caps. Let's see if the numbers change the market's dynamics. So far, I've been anticipating an inability to take out Friday's highs and that's worked well. If volume does not pick up, however, it could be one of those slow, range bound days where it makes sense to take smaller profits when you have them. My downside target if we cannot get the pickup in buying is Friday's lows in ES.
8:40 AM CT - Just a little heads up. I'll be out of town Tuesday and Wednesday, working with traders at a hedge fund. I'll be updating TraderFeed during that time, but won't be doing the morning comments. I'll have a Weblog update tonight and then the next one after that on Wednesday evening. We're seeing modest volume--no significant institutional participation--in very early trade leading up to LEI, with relative weakness early on in ER2 and no extremes of buying or selling in the TICK to this pt. More volume is being transacted at the market bid than ask in ES, but again this is modest volume. So far consistent with a range bound market. Still watching closely to see if we can take out Friday's highs when we get buying. If not, I continue to lean to the sell side.
8:15 AM - We have a little firmness in the stock index futures prior to the open, with Leading Economic Indicators scheduled for 9 AM CT. The expectations are for some strength in LEI. Indeed, firmness in the economy has led to a recent rise in interest rates and taken away all expectations for a near-term easing by the Fed. As I will post shortly, these upturns in interest rates are associated with subnormal returns in stocks over a several-week horizon. I enter the day with a small initial core short position, given the loss of upside strength and momentum mentioned in the Weblog. The Weblog also has the day's pivot levels; I'll be watching carefully if we can hold above Friday's highs in all three major equity indices. If not, I'd expect us to take out Friday's lows. More after the open.
Momentum and Reversal Effects for the Swing Trader
If you get a week in which more stocks advance than decline, is that a buying opportunity? I went back to the start of 2004 (N = 158 trading weeks) and examined how many NYSE issues advanced on the week and how many declined. When we had more advancers than decliners (N = 98), the following week in the S&P 500 Index (SPY) averaged a loss of -.01% (52 up, 46 down). When we had more declining stocks than advancers, however (N = 60), the next week in SPY averaged a gain of .44% (38 up, 22 down). For a short-term swing trader, therefore, returns have been superior when buying strength and subnormal when buying weakness.
Interestingly, when advancing stocks were 2500 or greater--a level at which they exceeded declines by well over 2:1 (N = 24), the next week in SPY averaged a gain of .20% (15 up, 9 down). When advancing stocks were less than 2500 (N = 74), the next week in SPY averaged a loss of -.07% (37 up, 37 down). This suggests that when advancing stocks swamp declines, there tends to be short-term momentum follow-through. It is when advancers lead declines by non-extreme amounts that we see subnormal returns over the next week.
Although we've only had a relative handful of occasions since 2004 in which weekly declining stocks have been 2500 or greater (N = 12), we see a similar pattern. When declines swamp advances, the next week in SPY averages a loss of -.23% (5 up, 7 down). When declines lead advances by a more narrow margin (N = 48), SPY averages a very healthy gain of .60% (33 up, 15 down). Once again, when declines lead advances by an extreme margin, there tends to be short-term momentum follow-through. It is when declines lead advances by non-extreme levels that we see superior returns over the next week.
These findings have relevance for short-term swing traders. Extreme market strength or weakness can be traded for momentum follow-through. More moderate moves can be traded for possible reversal--particularly when those moves are to the downside. I will be investigating this dynamic with daily measures of strength and weakness as well.
Sunday, January 21, 2007
Swing Trading With Weekly Pivot Levels: Part Two
In the first posting of this series, I built upon the framework of trading daily pivot levels to explain how a swing trading method could be devised from weekly pivot numbers. This would enable those traders who approach trading part-time, as a recreational supplement to income, to develop a systematic approach to trading, while still freeing them for other work and family obligations. My recent article showed how the previous week's high, low, and average prices are reasonable price targets for such a swing approach. Now let's take a look at the pivot-derived resistance and support levels.
Recall that we are defining two levels of upside resistance and two of downside support. The basic pivot level (P) is the average of the prior week's high, low, and closing prices. R1, then, is computed as (P*2)-L, where L is the prior week's low price. R2 is defined as P+(H-L), where H is the prior week's high price. Similarly, S1 is computed as (P*2)-H and S2 is P-(H-L).
Going back to 2004 (N = 158 trading weeks) in the S&P 500 Index (SPY), we find that exactly half of those occasions (N = 79) surpass the R1 first level of resistance. When the weekly number of advancing stocks exceeds the number of decliners (N = 98), 68 of those occasions--about 70%-- surpass R1. When the number of weekly advancing stocks exceeds 2300 (N = 48)--a level at which advancers lead decliners by roughly 2:1 or better--fully 45 of those occasions exceed R1. Conversely, when we have fewer than 2000 advancing stocks on the week (N = 83), only 22 of those occasions--a little less than 30%--exceed R1. It thus makes sense to use the ongoing count of weekly advancing vs. declining stocks as one yardstick for handicapping the odds of hitting the R1 target.
Interestingly, only 31 weeks of the 158 since 2004 have surpassed the R2, second level of resistance. Even when weekly advancing stocks have led decliners (N = 98), only 30--or about 30%--of those occasions exceeded R2. When the weekly advancers have exceeded 2300 (N =48), exactly half of those occasions (N = 24) have risen beyond R2. My observation of occasions when we've hit R2 suggests that good market breadth (advancers vs. declines) is not enough to guarantee solid odds of reaching the target. In addition, there must be above average volatility and strong market momentum (many stocks trading above their short-term moving averages). It thus makes sense to rely on prior week highs and R1 as price targets, only holding positions for R2 in markets that are showing very bullish momentum and breadth.
Now let's take a look at the S1 and S2 levels of support. Overall, only 63 of the 158 trading weeks trade below the S1 level. When advancing stocks lead decliners on a weekly basis (N = 98), only 15 of those occasions--about 15%--ever trade below S1. On the other hand, when decliners lead advancers on a weekly basis (N = 60), 48 of those occasions--80%--trade below S1. Clearly, the strength of advancers vs. decliners is displaying some promise in identifying the likelihood of hitting our first downside pivot price target.
As you might guess, not too many of the weekly occasions trade below S2: only 26 of the 158 weeks. When advancers have led decliners (N = 98), only 4 of those occasions traded below S2--about 4%. When declines have led advancers (N = 60), 22 of those occasions surpassed S2 to the downside--a bit less than 40%. When declining stocks have exceeded 2300 on a weekly basis, meaning that they outnumber advances by about 2:1 or more (N = 19), 12 of those occasions--a little more than 60%--hit S2. It thus appears, as with R2, that it takes more than negative breadth to hit S2; we also need above average volatility and downside momentum.
Finally, does hitting a pivot level tell us anything about the *next* week's trade? When we trade below S1 (N = 63), the next week in SPY averages a gain of .43% (40 up, 23 down). When we don't hit S1 (N = 95), the next week in SPY averages a loss of -.02% (50 up, 45 down). Such tendencies toward reversal are useful in anticipating the next week's likelihood of hitting initial price targets. Additional indicators of volatility and momentum are needed to reliably handicap the odds of hitting the more distant R2 and S2 targets. I used advancing vs. declining stocks simply because it is an easily available measure of market strength. It is very likely that other measures--such as the Demand/Supply momentum measure tracked by the Weblog--will perform even better. Clearly this is work in progress.
Saturday, January 20, 2007
Swing Trading With Weekly Pivot Levels: Part One
In a recent posting, I explained how I utilize the pivot price levels originally developed by pit traders to establish potential price targets/exits for intraday trades. Basically, this method begins with historical patterns to anticipate next day price movement and then handicaps the odds of reaching target pivot levels by continually updating market demand and supply, as revealed by the number of stocks trading at bid vs. offer (Adjusted NYSE TICK) and the proportion of ES volume trading at bid vs. offer (Market Delta). At the request of readers, I am now publishing next-day pivot levels daily on the Trading Psychology Weblog. I'm also using morning comments on the stock indices to illustrate an updating of my thinking in real time; here's an example from Friday's trade. Note how I flipped my thinking from anticipating a downside test of the prior day's lows at 8:50 AM to leaning to the long side at 9:06 AM following the release of the Michigan sentiment numbers. After some choppy trade, the absence of selling finally emboldened the bulls to enter the market and we were able to hit profitable upside price targets.
Note that this kind of trading requires a very close monitoring of the market and an active processing of new information as it arrives. Many traders cannot follow the market this closely and may lack either the interest or the skill sets to process large volumes of incoming data. For those traders, might it be possible to develop swing-trading methods based upon weekly pivot levels? This post and the next one will explore this framework.
What this means is that, instead of tracking markets intensively and updating our views every few minutes, we would track the market at most a couple of times daily and update our odds of hitting price targets identified at the start of the trading week.
The most basic price target levels I track in my own trading are the high, low, and average trading price from the previous day. Let's take a look at how often we hit those price levels on a weekly basis.
Since 2004 (158 trading weeks) in the S&P 500 Index (SPY), we have exceeded the prior week's high 98 times and failed to hit that level 60 times. We have traded below the prior week's low 72 times and failed to take out the previous week's low 86 times. Clearly, these results are a reflection of the general bull market environment we've had over that time.
Interestingly, only 10 of the 158 trading weeks since 2004 have been inside weeks. That is, more than 90% of all weeks will either take out their previous week's high, low, or both. For all practical purposes, that means that we can assume at the start of a week that we will hit either the high or low. It is up to our historical patterns and market updating to help us handicap the odds of hitting one or another of those price targets.
One simple way to update demand vs. supply in the market is to track the proportion of stocks advancing vs. declining for the week. When we have had more weekly advancers than decliners since 2004 (N = 98 trading weeks), 74 of those occasions have taken out the prior week's high--about 75%. When we have had more than 2000 advancing NYSE stocks on the week (N = 75), 62 of those occasions--over 80%--have taken out the previous week's high.
On the other hand, when we've had more weekly declining stocks than advancers (N = 60), 43 of those occasions--about 70%--have taken out their prior week's lows. When we've had more than 2000 declining stocks in a trading week (N = 40), 34 of those occasions--almost 90%--have taken out their prior week's lows.
In short, by updating breadth numbers during the trading day and from day to day, we can update our odds of hitting either the prior week's high price or low price.
Here's another potential price target: if we compute the prior week's average trading price simply as the pivot level--the average of the week's high, low, and close prices--then we see that fully 147 of the 158 weeks touch their previous week's average price. This overlapping of prices from week to week is attributable to reversal effects on a daily basis. When markets move up, they tend to retrace some of that gain and vice versa. Thus, if we close away from the prior week's average price, we still tend to revisit it during the trading week.
As for historical patterns, here's a simple one: When we have exceeded the previous week's high (N = 98), the *next* week in SPY averages a gain of only .07% (55 up, 43 down). When we have failed to exceed the previous week's high (N = 60), the next week in SPY averages a gain of .32% (35 up, 25 down). And when we take out the previous week's low price (N = 70), the next week in SPY averages a whopping gain of .51% (44 up, 26 down). When we fail to take out the previous week's low (N = 88), the next week in SPY averages a loss of -.12% (46 up, 42 down). In short, simply knowing how the previous week traded can help you handicap the odds of taking out that prior week's highs or lows.
By focusing on different time frames, active traders of the stock indices can achieve a measure of diversification. Also, these methods can be easily applied to individual equities, updating their strength vs. weakness by such measures as on-balance volume or money flow. But how about pivot levels S1, S2, R1, and R2? Can these serve as meaningful weekly price targets? That will be the topic of my next post.
Friday, January 19, 2007
Friday, January 19th: Morning Comments
9:58 AM CT - OK; it's off to work as Trader Shrink. The AM illustrated a few important things. First is the importance of flexibility. The odds of taking out yesterday's lows in ES were quite high, and that was my initial leaning. When selling dried up early in the AM with only a modestly negative TICK and not many stocks declining relative to advancers, I entertained the reverse hypothesis: that we were not getting selling and that leaning to the long side was the way to go. The second principle illustrated is the importance of patience. It was a choppy morning session, and it was easy to get scared out of a good position. But as long as the overall dynamics of supply and demand were not shifting, patience was indicated. Finally, you can see how a drying up of selling (today relative to yesterday) often precedes an influx of buying. That's a pattern that sets up intraday as well as on a swing basis. Hope that's helpful; as I write, keep an eye on NQ--showing a bit of short-term relative weakness. Have a great weekend; update tonight on the Weblog.
9:44 AM CT - Finally! We couldn't muster selling and once again the semis (and DAX) led the way before we got a price breakout in NQ and ES. Notice how in this kind of market, you either have to be very short term oriented and take profits quickly or very patient and let a larger move unfold. As long as the dips in the TICK couldn't bring us to new price lows, staying with the long side leaning made sense. But it took real patience, given the chop. Back for a wrap up shortly.
9:31 AM CT - We continue to see very modest selling and recent strength in semis. I continue to lean to the long side as long as we don't see lower TICK lows. DAX has been a good leader this AM.
9:23 AM CT - Well, I've scratched two trades this AM, both on good ideas, but just no follow through on the market moves. We're oscillating around that 1435 area VWAP; advancers lead declines by only 100 or so issues--no real conviction, and that's not my best trading environment. In such a market, you want to identify the day's average trading price as early as possible and fade moves away from that region as buying/selling dry up. I find that you have to exit such positions quickly when profitable; it's very easy for your several ticks of profit to reverse--which is what happened on both my scratched trades. Still no real signs of selling conviction in the TICK, but buying is not sustained either, keeping us in the range.
9:06 AM CT - Lots of cross currents with the sentiment numbers; dollar strength interest rates up. Pullback after the rise, but I'm looking to see if we get lower TICK lows. If not, I'm leaning toward buying. Sellers have not shown conviction thus far.
8:50 AM CT - So far, lack of downside and upside conviction and volume tailing off, leading me to suspect rangebound day. Still anticipating test of lows unless I see evidence of meaningful buying.
8:41 AM CT - DAX strong, but I want to see ER2 buying before I'll commit long. If ER2 stays below its preopen range, I'm selling for test of lows.
8:24 AM CT - Forgot to mention; DAX has been strengthening through much of pre-opening trade and that's led to a bit of a bid now in the US indices. Something I'm watching.
8:19 AM CT - Not a big news day; Michigan sentiment numbers at 9 AM CT and that's it. We have options expiration today, so some chop and rangebound trade would not be unusual. We're trading at the lower end of yesterday's distribution, so I would not be surprised to take out yesterday's lows, especially if we continue to see underperformance from ER2 and NQ. My full market wrapup, strategy, and pivots for today are on the Weblog; I'd expect a test of the 1429 S1 level on ES if we start out with below average NYSE TICK readings. Overnight resistance is 1434; Thursday VWAP is 1435; inability to sustain selling in the AM should bring us to those levels, which would be consistent with rangebound trade. I'll be keeping an eye on early volume to handicap the odds of such rangebound action. The 1431 region is also overnight support. If you get some free time, check out the post on trader personality; some interesting findings from a recent pilot research study. Back after the open.
Subscribe to:
Posts (Atom)


