If I had to summarize my research approach to the equity indices, it would be this: unique information can be gained by understanding what individual stocks are doing above and beyond the movements of the broad indices. This perspective is captured in the old saying that it's not just a stock market, but also a market of stocks.
A market index is an average--often a weighted one--and, as such, loses as well as conveys information. Knowing that we made a new high in the Dow Jones Industrial Average doesn't tell us whether the broad majority of issues made new highs or whether upside momentum among those stocks is strong or weak.
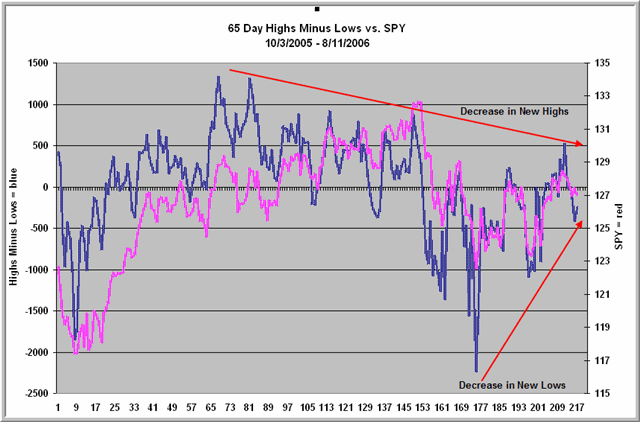
Above is a chart that I created last month by comparing SPY to the number of stocks in the NYSE, NASDAQ, and AMEX that made fresh 65-day highs minus lows. Notice that, as the market (red line) was making new highs from March through May, new highs were shrinking. Notice also the decreasing new lows as we bottomed between June and July.
I find that shifts in momentum among the broad list of stocks also provides useful information. Readers of the Weblog are familiar with my measure of Demand and Supply. This measure takes every operating company stock and tracks its price against volatility envelopes surrounding two moving averages: one short-term, one intermediate-term. If the stock closes above *both* envelopes, it counts as Demand. If the stock closes below *both* envelopes, it counts as Supply. Thus, what we're tracking is an index of the number of issues that are either significantly strong or weak in price. Everything in between is eliminated.
As mentioned in today's Weblog entry, we had the unusual situation of a market (SPY) making a 20-day high, but showing more stocks closing below the volatility envelopes surrounding their short and intermediate-term moving averages than closing above (i.e., Supply exceeding Demand). Since 2003 (N = 927 trading days), we've had 48 such occasions. Two days later, SPY has averaged a loss of -.17% (20 up, 28 down). That is notably worse than the average two-day gain of .08% (491 up, 436 down) for the entire sample.
Since 2004, when we've had a 20-day high in SPY and a negative Demand/Supply balance (N = 30), the market has been up two days later 10 times and down 20, for a similar average loss. Since 2005, a 20-day high in SPY and a negative Demand/Supply balance (N = 16) has led to an average two-day loss of -.22% (5 up, 11 down).
We see a similar, but less pronounced, pattern when SPY makes a 5-day high, but the market has a negative Demand/Supply balance. Since 2003, there have been 77 such occasions. Two days later, SPY is down by an average -.06% (36 up, 41 down); a subnormal return.
Markets tend to peak by first making momentum highs in which a majority of shares make new highs. Then, as the broad averages grind higher, we see a distribution phase in which some stocks weaken while others continue on to new highs. It's at this phase that we see fewer new highs (as depicted above) and decreased momentum (Demand/Supply). Finally, the weakest stocks begin making fresh short-term lows (trade below their volatility envelopes) and sellers begin hitting bids in the broad list of stocks. That turns the NYSE TICK negative: a decline is typically not far away.
Note that, over the past three sessions that the market index (SPX) has been up, we've had more hitting of bids than lifting of offers among the broad list of NYSE stocks. As mentioned in the Weblog, the Adjusted TICK has been negative all three of those days.
The market index does provide useful information, but it is less than the sum of its parts. Knowing what individual stocks are doing provides important clues to the fate of the broad market.


