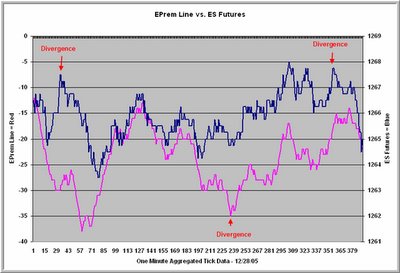
Recently on my site, I mentioned the S&P emini premium to cash as a valuable market indicator reflecting program trading activity. Below is a chart from the 12/28/05 market that tracks the emini premium relative to separate buy program and sell program levels through the day. When the line is rising, it means that there is buying pressure in the ES as gauged by pricing relative to the buy level criteria. A falling line means the reverse. As we can see from the chart above, divergences between the Premium Line (red) and price (blue) are of interest to the short-term trader. I'll post further details on the Weblog.


